

AI · 18 October 2026 ·

Translated with AI. This article was translated by an AI model from an article by Twentynext in another language, and the translation was checked automatically against the original. Verify figures and sources before acting on them. See our disclaimer.
The term probably also appears in your annual plan or information strategy. Dashboards have been built, a data platform has been purchased and a programme is under way. And yet, in the monthly meeting, the opinion of whoever talks loudest or has been with the organisation longest still wins.
This explanation sets out what data-driven working does and does not involve, how you can tell whether your organisation already does it, and where it usually runs aground in practice. So that you can assess a current initiative more sharply or start a new one with realistic expectations.
Data-driven working means that you base decisions on facts rather than on assumptions, habit or gut feeling. In a webinar by the Vereniging Projectmanagement Nederlandse Gemeenten (Association for Project Management in Dutch Municipalities), it was described as steering action based on the systematic collection, management, analysis and interpretation of data.
The word that carries the most weight in that definition is steering action. It is about the decision and the action that follows from it. Data is the means; the decision is the goal.
That sounds obvious, but in many organisations the programme in fact revolves around the data itself: collecting, linking, visualising. Whether decisions are subsequently made differently is something nobody measures. That is precisely where it goes wrong.
Owning a dashboard is something different from steering with it. A report that is circulated monthly but never leads to a different decision is an administrative burden with an attractive front end.
Nor is it an ambition to measure everything. Anyone who tracks dozens of indicators at the same time easily loses sight of which of them a decision rests on. The question comes first, and only then the data. Which decision needs to improve, and what do you need to know for that?
And it does not mean that figures replace people. Data can make visible what is happening; what that means and what should then happen is a judgement you preferably leave to someone with knowledge of the work. The description by SBO also concerns decisions based on analysis and interpretation of data. Anyone who skips the interpretation is steering on noise.
It helps to distinguish between three types of decision. They require different data, a different frequency and different people.
An employee assesses an application, schedules a maintenance visit or handles a report. Here, data supports the day-to-day judgement: what is the history, what is usual, what deviates? This requires reliable data at the source and a system that shows it at the right moment.
A team lead or process owner looks weekly or monthly at lead times, repeat contacts, failures or the backlog. Here it is about patterns: where does it get stuck, what takes a disproportionate amount of time, which adjustment worked? At this level the distance between figure and intervention is shortest: the owner who sees the trend can also adjust the process.
Management and the board substantiate scenarios: capacity for the coming years, investments, priorities. Here data does not provide answers, but it does provide substantiated assumptions and a way to test afterwards whether the choice was right.
Our advice is to start at the process level: that is where you can experience what working with data demands in practice. If you start directly at the strategic level, in our estimation you build up that experience less quickly.
Forget the tooling for a moment and look at behaviour. A few questions that say a lot:
This is not a validated test, but an indicative rule of thumb: if the answer to most of these questions is no, then in our reading that suggests you have a data provision, but not yet a data-driven way of working. That is not a reproach; it is a starting point.
Below are patterns we encounter in this type of initiative. They are observations from our own practice, without research behind them; what strikes us is that they are more often about agreements and behaviour than about technology. That picture is consistent with research by Conclusion among some 600 IT decision-makers, described on Consultancy.nl, which cites a lack of knowledge and willingness to change as an obstacle.
Starting with the tool. A platform is chosen before it is clear which decisions need to improve. The result is a well-functioning environment that nobody has a question for.
Definitions that differ between departments. Two teams both report “number of open cases” and arrive at different figures. The discussion then turns to the figures instead of the work. Without agreed definitions and an owner for each term, such a meeting easily grinds to a halt.
Data quality that only becomes apparent once the dashboard is in place. As long as data sits only in an operational system, empty fields or duplicate records can go unnoticed. As soon as they appear on a screen, they become visible. Bear in mind that part of the work at the start may go into repairing the source; how much is difficult to estimate in advance and depends on the state of your records.
No decision moment. The report is finished, but there is no meeting where it is on the table and where someone has the mandate to change something on the basis of it. Data without a decision moment remains information.
Unrealistic lead time. How long it takes to make one process visible and to steer it structurally depends heavily on the state of the source and the availability of the owner. The habit of asking for substantiation everywhere before a decision is made is a change in behaviour. Expect that it may take more time than building the report, and that it helps if management sets the example itself. Managementboek.nl also calls the transition stubborn because it demands culture, infrastructure and skills.
Personal data as an afterthought. As soon as you process personal data when steering, the Algemene verordening gegevensbescherming (AVG, the General Data Protection Regulation) applies. Personal data is data that can be traced back to a person, for example about citizens, clients or employees. Truly anonymised data does not fall under it; whether data is really anonymous does deserve a critical look. The main principles include, among others, a legal basis for the processing, purpose limitation, not collecting more than necessary, not retaining data longer than necessary for the purpose, transparency towards data subjects and appropriate security. This is not legal advice; what it means in concrete terms in your situation is best put to your privacy officer early on. If this only comes up late, it can lead to adjustments or delays in the initiative.
Data-driven working is to a significant extent a matter of culture and behaviour; Managementboek.nl also describes it as more than a technical exercise, with a shift in organisational culture. What you do as a decision-maker carries a lot of weight in that. Three things lie with you.
First: ask for substantiation yourself, even when the answer does not suit you. The moment uncomfortable figures are waved away, the organisation knows that it is still about opinion after all.
Second: bear in mind that the first figures may show anomalies. See those initially as information about your records and definitions, before you draw conclusions about people from them. Anyone who holds people to account on the basis of a first, imperfect report runs the risk that the figures will subsequently be delivered polished.
Third: do not expect everyone to become equally data-skilled. Passionned puts it this way: every member of staff must be able to work in a data-driven way, but that does not mean everyone needs to be equally data literate. We translate that as working with data at the level of one’s own decision, which is something different from training everyone to be an analyst. A process owner must be able to read a trend and ask the right question. Building the analysis can lie with a small group.
Choose one recurring decision that is currently made on gut feeling. For example, the weekly allocation of capacity across a backlog, or the prioritisation of reports. Choose something with a fixed owner and a fixed meeting moment.
Together with that owner, write down on a single side of A4: which question must be answered at that moment, which data is needed for it, where that data is now and who maintains it. For four weeks, explicitly place the decision alongside the figures and note what went differently from what was expected.
The aim of those four weeks is that you are left with concrete observations about the state of your data, your definitions and your meeting culture. And you have a concrete starting point for testing the programme that may already be under way against the core question: are decisions being made differently?
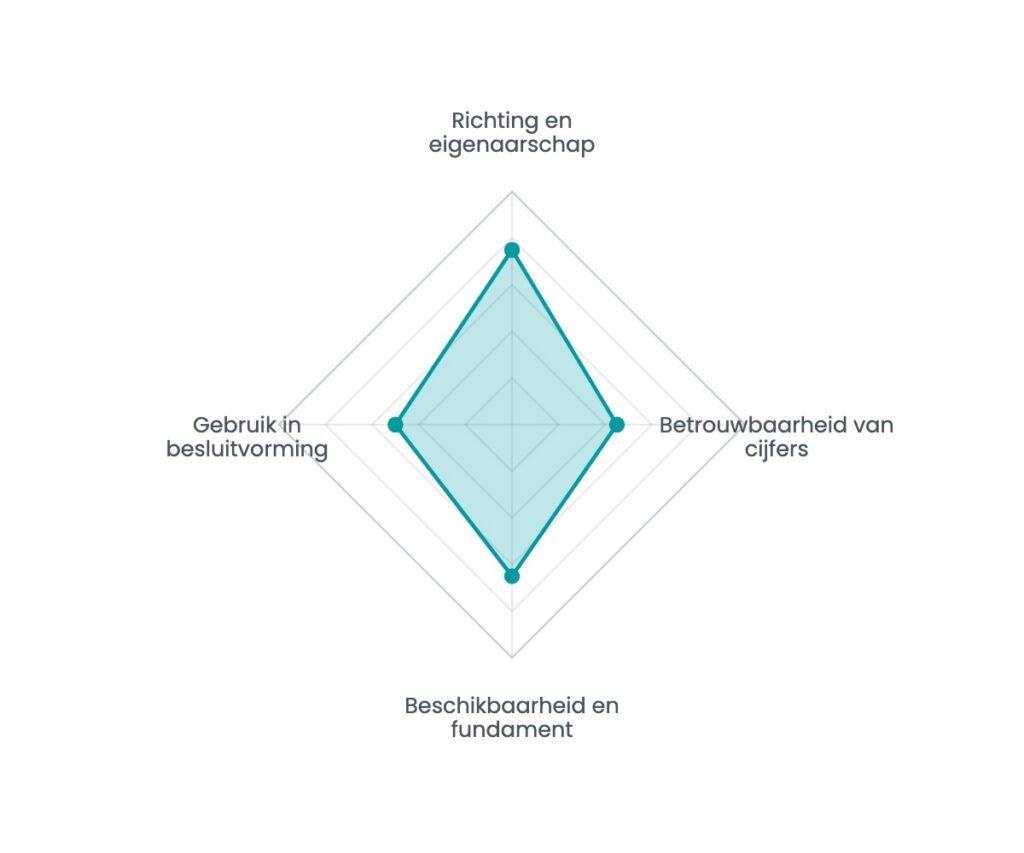
Sixteen questions, seven minutes, and an instant spider chart showing your strongest and weakest dimension. No e-mail address needed to see the result.
AI · 20 October 2026
A model that performs well in testing can deliver less than expected in practice. Learn why trust drives AI value in government and how to measure it.
Read the article →

AI · 18 October 2026
An honest checklist: six questions that determine whether your organisation is ready for AI, and what the next step is if the answer is no.
Read the article →

AI · 18 October 2026
Almost every organisation that gets serious about data faces the same question: who is actually going to do this? Build, hire or outsource?
Read the article →
Work with us
The people who build it also run it afterwards. Eindhoven, since 2014.
We use Google Tag Manager to measure visits and Leadinfo to recognise which company is visiting. Neither loads unless you agree. If you choose essential only, the site works as normal and we measure nothing. Cookie statement · Privacy statement
