

AI · 20 October 2026 ·

Translated with AI. This article was translated by an AI model from an article by Twentynext in another language, and the translation was checked automatically against the original. Verify figures and sources before acting on them. See our disclaimer.
A familiar pattern: a model that performs well in the test environment delivers less than expected in practice. Staff manually check every outcome, for example, team leaders hesitate to roll it out widely, or the project is put on hold at the first critical parliamentary question. The business case added up on paper, but the benefits may then fail to materialise.
The cause need not lie with the algorithms. The brake may lie with people who do not trust the outcomes, and with organisations that have not put in place what is needed to earn that trust. Below you can read where that trust breaks down and how to include it in the way you measure the value of AI.
If you measure AI value only by a model’s accuracy or processing time, you miss most of the story. A related question is: do people use the outcome in their work?
An article on iBestuur about the SAS Data & AI Impact Report 2026 states that the brake on value lies mainly in the fact that people do not always trust the outcomes. The research, carried out by IDC, describes trust as a direct economic factor. Investments in governance, data quality, explainability and oversight are linked to the value organisations derive from AI.
That is worth checking for your own application. If a team reassesses every prediction itself, it is questionable how much of the intended time saving remains in practice.
Within government, the bar for a system error can be higher than for an error made by an employee. The Omgevingsdienst Midden-Holland states this in its AI policy in so many words: we are much more critical of an error by an AI application than of a human error, and that can cost the trust of stakeholders.
That is not an irrational reaction. With a system, you have to arrange in advance who provides the explanation and who is accountable.
So bear in mind that a visible error can damage trust in an application. That risk belongs in your risk analysis, and in your planning too.
Trust in AI in government is not a single problem. It plays out among different groups, and each group requires something different.
The professional who has to work with the outcome wants to know what that outcome is based on and when they may deviate from it. Without that answer, they may start to ignore the system or, conversely, follow it blindly. Both are undesirable.
Administrators and senior civil servants must be able to account for what the organisation does, each from their own role. They want to be able to explain what the system does, who supervises it and what happens if it goes wrong. If they cannot, that may be a reason for them to pause or stop a project.
Research by EY into AI in the Dutch government states that 39% of respondents trust the ability of governments to manage AI properly. The summary does not show which group was surveyed, so treat the figure as an indication for that research group. The AI barometer published by Nederland Digitaal in April 2026 shows that Dutch people are using more AI while trusting it less. Even among Gen Z, 90% of whom use AI, only just over half (54%) are positive about it.
For an implementing organisation, that is a point of attention: expect some citizens to be watching critically. According to the same barometer, the demand for strong regulation is greater than ever.
Outdated systems and limited access to data are real problems. Yet EY, in the same report, names fear of mistakes and loss of control as the real brake, plus a culture that sees innovation as a risk. One interviewee puts it sharply: “For 20 years we promoted people who made no mistakes, and that blocks progress.”
A blog by the University of Twente on public management contains a related warning. Bureaucracy runs on professionals with craftsmanship, judgement and legal sensitivity. An AI project that treats the organisation as a machine in which you replace a component does not fit how the work is actually done.
Our advice: involve the people who do the work from the start. They know where the exceptions are, and their input can benefit both the solution and support for it. Pioneers in the EY research involve staff in developing AI solutions, alongside strict ethical frameworks and active communication with citizens.
There is also a reverse problem: too much trust of the wrong kind. The AIV advisory report AI: technologie, macht en democratische waarden (AI: technology, power and democratic values) warns that relying on non-transparent algorithms can lead to responsibility being shifted to “the system”. With incorrect data or wrong outcomes, people are then unjustly disadvantaged, and afterwards it is barely possible to show where things went wrong.
As an example, the report cites the algorithms the Ministry of Foreign Affairs used for visa applications, which the Autoriteit Persoonsgegevens (Dutch Data Protection Authority) classed as problematic.
Healthy trust is therefore calibrated trust. Staff follow the system where it is reliable and deviate where their own judgement is needed. You have to design for that; it does not happen by itself.
If you want to demonstrate the value of AI, you need to make trust measurable alongside the classic performance figures. A few indicators you can consider:
Record a baseline measurement before you go live. Without a starting point, you cannot later show what has changed, and then the strongest feeling wins the discussion.
Be realistic about time, too. How and how quickly trust in an application develops differs per application and organisation, and is hard to predict in advance. If you want to learn more in a pilot than whether the model works technically, include usage and review in the measurement during the pilot itself.
Choose one AI application that is already running or about to go live. Organise a one-hour session with two or three caseworkers who use it and ask them three questions: when do you trust the outcome, when do you not, and how much time does reviewing take?
Put the answers alongside the original business case. A gap between them gives clues as to where a trust problem may lie. To determine where your next investment should go, then test those clues against the indicators above.
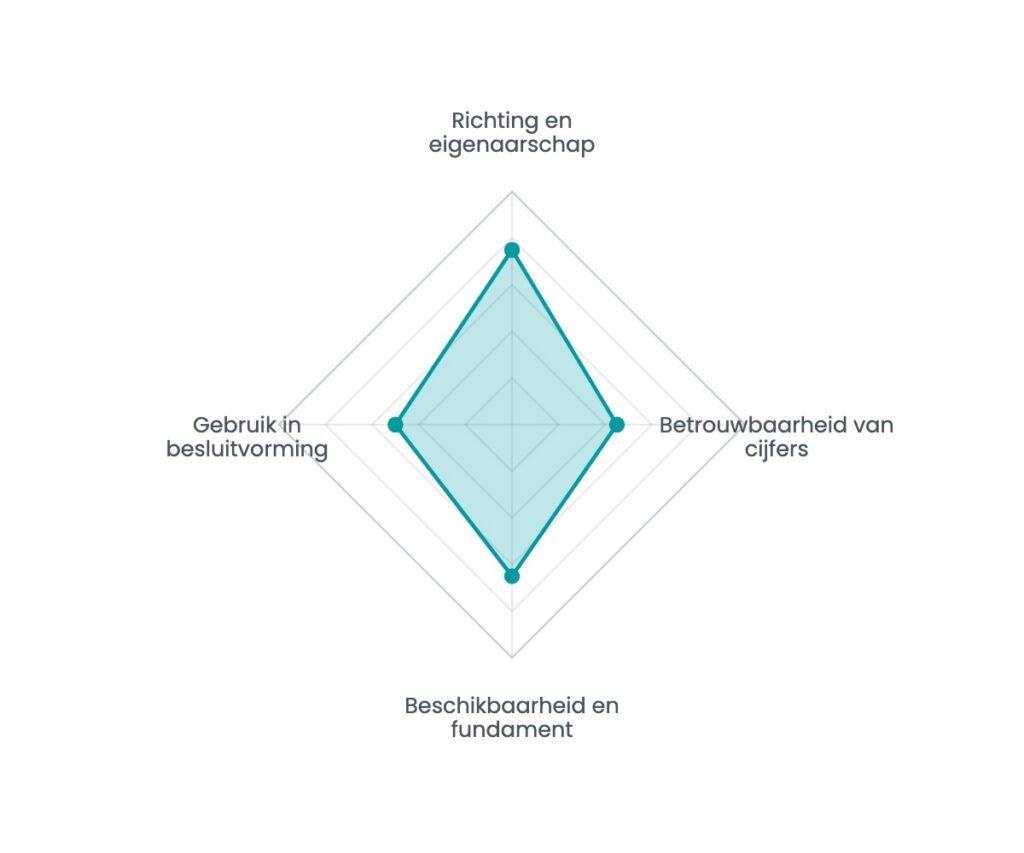
Sixteen questions, seven minutes, and an instant spider chart showing your strongest and weakest dimension. No e-mail address needed to see the result.
AI · 18 October 2026
An honest checklist: six questions that determine whether your organisation is ready for AI, and what the next step is if the answer is no.
Read the article →

AI · 18 October 2026
Almost every organisation that gets serious about data faces the same question: who is actually going to do this? Build, hire or outsource?
Read the article →

AI · 18 October 2026
Suppose the feature your Copilot pilot relied on is renamed, relicensed or moved after an update. Criteria and a scorecard for choosing a consultancy.
Read the article →
Work with us
The people who build it also run it afterwards. Eindhoven, since 2014.
We use Google Tag Manager to measure visits and Leadinfo to recognise which company is visiting. Neither loads unless you agree. If you choose essential only, the site works as normal and we measure nothing. Cookie statement · Privacy statement
